Correlation and causation revisited
Statistics students are taught that correlation does not equal causation. Just because two variables (e.g., x and y) are related to each other does not necessarily mean that one causes the other (e.g., x causes y). The correlation coefficients (i.e., ρ) for ρ(x, y) and ρ(y, x) are the same and does not provide information on the directionality of the effect (e.g., x → y or x ← y). It could also be that the variables are related due to a third variable z which causes both (i.e., a confounder).
However, over, two decades ago, Dodge and Rousson (DR; 2001) published a paper on On Asymmetric Properties of the Correlation Coefficient in the Regression Setting (which, as of 2025.05.26 had 106 citations based on Google Scholar). In the paper, when one of the variables is skewed or non-normally distributed, DR indicated that the cube of the correlation coefficient (ρ3) is equal to the ratio of the skewness of y and the skewness of x (see DR eq. 5):
$$\rho(x, y)^3 = \frac{\gamma_y}{\gamma_x}$$where the $\gamma$s represent the skewness of the variables.
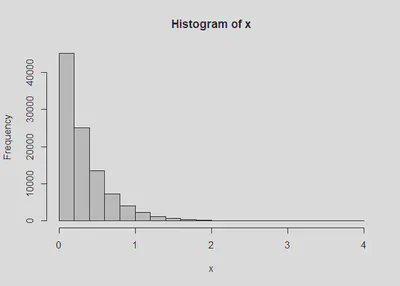
We can show this using simulated data. We create a skewed x variable using a gamma distribution (other code is there to show this using a chisq or a beta distribution):
library(psych) #for skew and kurtosi
set.seed(246) #for reproducabiity
ns <- 100000 #how many
# x <- rchisq(ns, 1)
x <- rgamma(ns, 1, 3)
# x <- rbeta(ns, 2, 5)
hist(x) #show the skewness
We then create a y variable which is a function of x plus some random error. In this case, by construction, we know that x → y and not x ← y.
y <- x + rnorm(ns)
#plot(x, y)
cor(x, y)

[1] 0.3116695
We can investigate eq. 5 of DR:
cor(x, y)^3

[1] 0.03027492

skew(y) / skew(x) #correct

[1] 0.03017388
They are similar and this is quite different from the skewness of x over the skewness of y (the alternative model).
skew(x) / skew(y) #incorrect

[1] 33.14125
In this case, we have support to show that y is our response/outcome variable.
This also extends to the kurtosis of the distributions:
$$\rho(x, y)^4 = \frac{\kappa_y}{\kappa_x}$$where κ refers to the kurtosis which is equivalent to the correlation to the fourth power.
cor(x, y)^4

[1] 0.009435768

kurtosi(y) / kurtosi(x)

[1] 0.009291302
The following (for the competing model) is way off:
kurtosi(x) / kurtosi(y) #incorrect

[1] 107.6275
These higher order moments (e.g., skewness and kurtosis) can be used to test competing hypotheses of whether x → y or y → x. The many papers of Wiedermann (see here for a list of papers and macros) explore different methods of testing what is referred to as the directionality of the effect (under more complex situations). There are many types of decision rules that can be used to test these hypothesis:
For example, in a regression framework (which is useful when there are more variables present), two competing models can be tested and the residuals from the model that are more normally distributed (closer to zero) is a more likely model:
m1 <- lm(y ~ x)
m2 <- lm(x ~ y)
skew(resid(m1)) #closer to zero

[1] -0.005953778

skew(resid(m2)) #further from zero

[1] 1.699309
If both variables are normally distributed (e.g., the skewness is zero), then the ratio of the skewness of y and x will be undefined (i.e., division by zero). In such a case, the results of the hypothesis testing procedure will be inconclusive and requires that one variable be non-normally distributed. So, if you have two sets of variables that are not skewed, this may be of more limited use. Also, the procedure has been critiqued by Thoemmes (2020) who suggests more sensitivity analysis be conducted when using these procedures (and also does not rule out that coefficients may be biased).
References
Dodge, Y., & Rousson, V. (2001). On asymmetric properties of the correlation coeffcient in the regression setting. The American Statistician, 55(1), 51–54. https://doi.org/10.1198/000313001300339932
Thoemmes, F. (2020). The assumptions of direction dependence analysis. Multivariate Behavioral Research, 55(4), 516–522. https://doi.org/10.1080/00273171.2019.1608800
Wiedermann, W., & von Eye, A. (2015). Direction-dependence analysis: A confirmatory approach for testing directional theories. International Journal of Behavioral Development, 39(6), 570–580. https://doi.org/10.1177/0165025415582056